

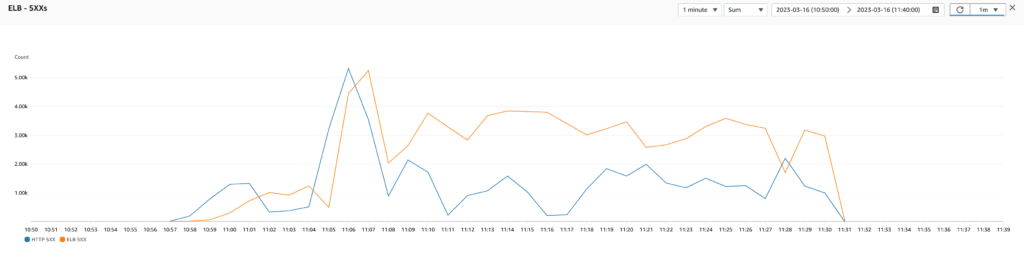
Picture this: It’s a dark, stormy night, and you’re sound asleep in your cozy bed, dreaming of code and APIs, finally relaxing after a long day at work. Suddenly, your phone starts buzzing non-stop, your heart sinks as you realize it’s the alerts from your production environment. You open your laptop as fast as possible, log in to your AWS console, and your worst fears are confirmed – your application’s availability decreased below 95% and is now reporting hundreds of 500 errors! That’s when you know – it’s the start of a DevOps horror movie.
Okay, so maybe it’s not quite as dramatic as a horror movie, but for developers who have experienced the nightmare of a bug in production, you know what I mean. Hi, I’m João Brilhante, a full-stack developer at Requirement Yogi, a small company developing Atlassian plugins to help users manage their requirements from Confluence and Jira. Our Atlassian Cloud plugins are hosted by us in AWS, which means we’re responsible for keeping it up and running 24/7. No pressure, right?
Moreover, these plugins have been accepted into the Cloud Fortified App Program, which means we have to meet high standards of reliability, security, and support. Indeed, it’s a prestigious designation that reassures customers that our applications can be trusted to handle their most critical requirements. But with great power comes great responsibility, and we knew that if we wanted to maintain our Cloud Fortified status, we had to optimize our AWS infrastructure and deployment to ensure maximum availability.
In this blog post, I’ll share with you my journey in resolving the issues with our AWS infrastructure and deployment, from configuring our application metrics to optimizing our Auto Scaling Group, and everything in between. I’ll share some best practices and key takeaways that we learned along the way, so that you can avoid some of the same pitfalls we encountered. So sit back, grab some popcorn, and let’s dive in!

Just interested in our results?
The Hunt for the Missing Metrics: Install the CloudWatch Agent
The first step in addressing the issue was investigating the source of the problems. We quickly realized that we were missing some crucial information about our infrastructure’s performance, like the actual memory and disk usage of our EC2 instances. Without this data, it was difficult to pinpoint the root cause of the errors. I don’t even understand why these metrics are not configured and enabled by default!
To improve the observability of our cloud infrastructure, we decided to install a CloudWatch agent on each EC2 instance. This would give us more granular data about our infrastructure’s performance, including memory usage. However, modifying the AMI image to include the CloudWatch agent wasn’t a straightforward task. We had to do some research and experimentation to ensure we were doing it correctly. We followed the AWS documentation to install the CloudWatch agent by modifying our AMI image and using the following configuration:
// /opt/aws/amazon-cloudwatch-agent/etc/amazon-cloudwatch-agent.d/additional_metrics.json
{
"agent": {
"metrics_collection_interval": 60,
"run_as_user": "root"
},
"logs": {
"logs_collected": {
"files": {
"collect_list": [
{
"file_path": "/var/log/first-app.log",
"log_group_name": "first-app.log",
"log_stream_name": "{instance_id}",
"retention_in_days": 60
},
{
"file_path": "/var/log/second-app.log",
"log_group_name": "second-app.log",
"log_stream_name": "{instance_id}",
"retention_in_days": 60
}
]
}
}
},
"metrics": {
"aggregation_dimensions": [
[
"InstanceId"
]
],
"append_dimensions": {
"AutoScalingGroupName": "${aws:AutoScalingGroupName}",
"ImageId": "${aws:ImageId}",
"InstanceId": "${aws:InstanceId}",
"InstanceType": "${aws:InstanceType}"
},
"metrics_collected": {
"disk": {
"measurement": [
"used_percent"
],
"metrics_collection_interval": 60,
"resources": [
"*"
]
},
"mem": {
"measurement": [
"mem_used_percent"
],
"metrics_collection_interval": 60
}
}
}
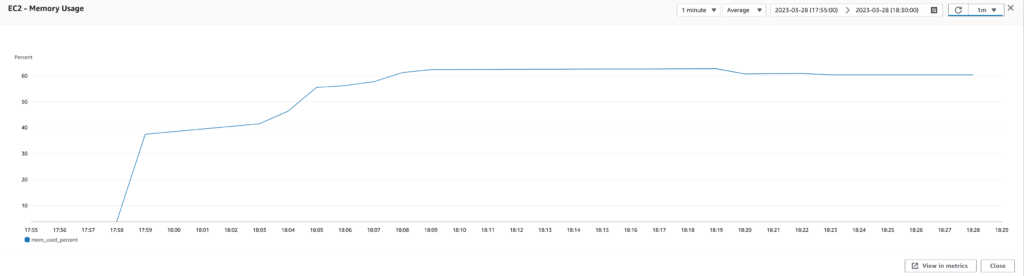
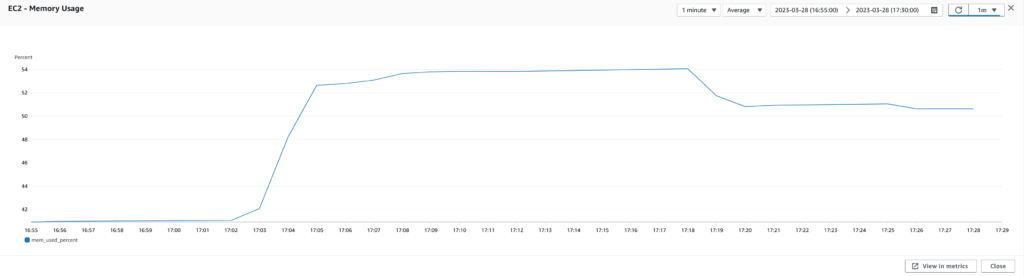
}Once the CloudWatch agent was installed, we started getting more detailed insights into our infrastructure’s performance. We could now track metrics like memory usage (average, min, max) and disk usage (average, min, max). This gave us a better understanding of how our infrastructure was behaving and allowed us to identify any bottlenecks or issues.
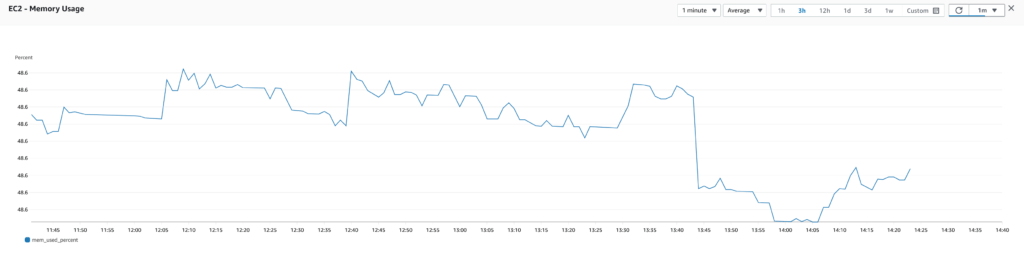
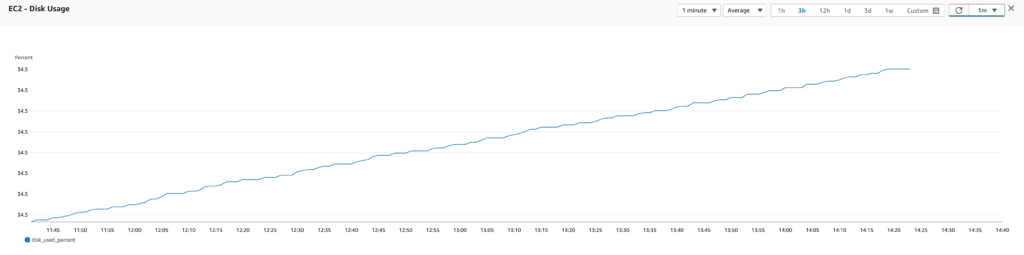
With improved observability, we were able to detect and address issues more quickly. For example, when we noticed that memory usage was very high, we were able to take proactive measures to prevent the EC2 instances from running out of memory and crashing.
Overall, improving observability was a crucial step in optimizing our AWS infrastructure. With more detailed insights into our infrastructure’s performance, we were better equipped to make data-driven decisions and keep our Atlassian Cloud plugins running smoothly.
The Instance Sizing Struggle is Real: Choose the Correct Instance Type
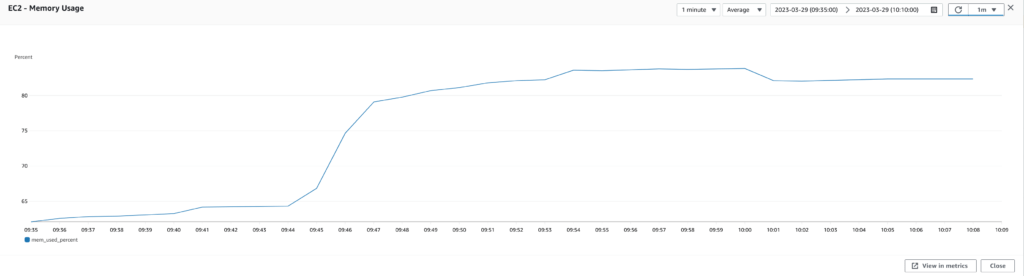
After improving observability by installing the CloudWatch agent on our EC2 instances, we were able to track metrics like memory usage and disk usage. It quickly became apparent that memory usage was a major issue, with usage hovering around 90%.
To tackle the issue, I decided to run some performance tests to identify the optimal infrastructure and configuration. Using JMeter, we could simulate real-world loads and generate valuable insights into our infrastructure’s performance. The team already had developed a JMeter test to run some performance tests, so I only had to update it a little to handle new endpoints and configure it to generate a load close to the one we see in the production environment.
Extract the performance baseline
I started by running a performance test with our current infrastructure and configuration as a baseline. I collected metrics from CloudWatch and JMeter, including response time, latency, CPU utilization, memory usage, disk usage, database IOPS, etc. Using these metrics, we could analyze the test results and identify areas for improvement.
Upgrade the instance type
One of the first changes we tested was upgrading the EC2 instance type from t4g.small to t4g.medium. This immediately improved our results, reducing the number of 500 errors and improving response times. We also tried testing with t4g.large instances but found minimal performance gains.

Set the maximum heap memory size
Next, we wondered if the two applications running on each EC2 instance were battling for memory resources. To address this, we defined a max heap memory size for each application using the -Xmx JVM option. We also allocated more memory to the Confluence plugin, which was more heavily used than the Jira plugin.
Running the tests again with the updated configuration, we saw significant performance improvements. The number of 500 errors decreased even further, and response times improved even more. Ultimately, we settled on t4g.medium instances with an -Xmx of 2.5G for the Confluence plugin and an -Xmx of 1G for the Jira plugin.
To conclude, continuous monitoring and assessing the size of our infrastructure were crucial in ensuring that it could handle the application load and maintain reliability and performance. As we saw, even minor adjustments had a significant impact on the overall stability of the system, highlighting the importance of staying vigilant and proactive in maintaining our infrastructure.
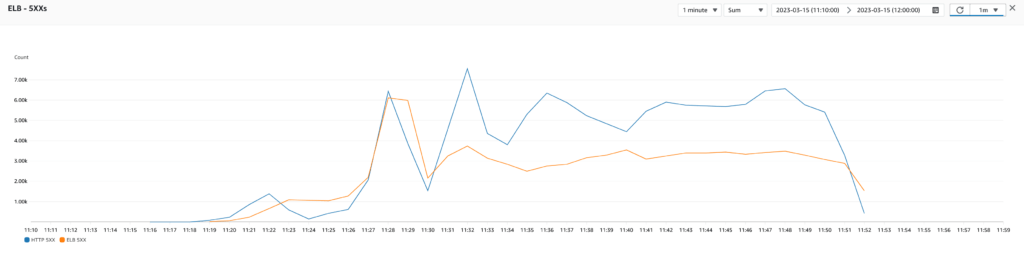
Scaling to Infinity and Beyond: Improve the Auto Scaling Policy
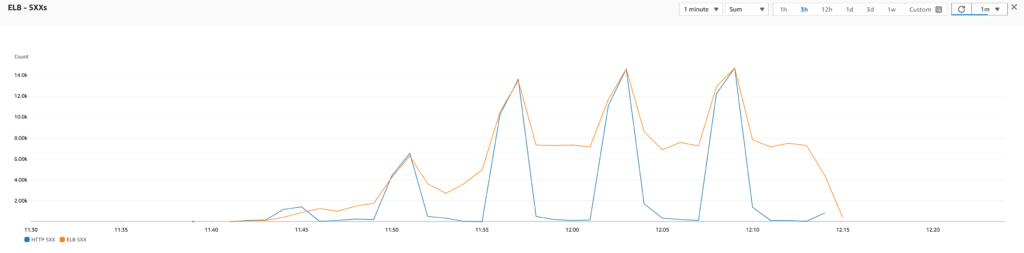
Moving forward in this journey, I wanted to improve the availability of the application even further. Indeed, in the production environment, we noticed that some EC2 instances were sometimes replaced even though we didn’t deploy anything. By investigating the activity of the Auto Scaling Group, I noticed that it was due to the health check causing EC2 instances to sometimes be marked as unhealthy and replaced. Looking closer at previous test results, I confirmed that multiple instances were being replaced for no apparent reason (the CPU usage was low, the RAM usage was average, the network usage was low, etc.). This needed to be addressed.
Extract the performance baseline
My first idea was to improve the scalability of the application. Indeed, the Auto Scaling Group had a single scaling policy based on CPU usage (target tracking scaling policy using CPUUtilization, with a target value of 70%). However, during the performance tests, the application sometimes seemed to struggle without scaling out. The Auto Scaling Group always had the minimum number of instances, despite the application struggling to keep up with the requests.
To find the best metrics for scaling, I used the same technique as before: run performance tests with slight modifications to the scaling policies to see which is best for our use case. I kept the minimum of instances to 2 and bumped the maximum number of instances in the Auto Scaling Group to 16 to see if the scaling policies generated too many scale outs. Then, I tested multiple scaling policies one by one.
Test 1: Target tracking scaling policy using TargetResponseTime
I first tested by adding a target tracking scaling policy using the TargetResponseTime of the ELB with a target value of 10 seconds which seemed reasonable (ideally, we would want all requests to be processed in way less time than that to make the experience enjoyable for the users). However, the test results indicated that this scaling policy generated too many scale outs. The problem was that the response time did not evolve much when a new instance was added, so the scaling policy kept being triggered with little to no effect on the overall application performance. I also tested with different target values and with a step scaling policy to define the steps that trigger a scale out but with was the same thing. It seems that the response time is not a good metric for scaling for our use case.
Test 2: Target tracking scaling policy using RequestCount
Then, I documented myself on the subject, and it seemed that many people used the number of requests as a metric for their scaling policy. So, without further ado, I tested a target tracking scaling policy using the RequestCount metric (reported by the ELB) with a target value of 1000 requests (which seems to be the point from which the application started to struggle). However, from the test results, this also generated too many scale outs. The problem was the same as before. The number of requests received by the infrastructure does not decrease with the addition of new instances.
Test 3: Target tracking scaling policy using RequestCountPerTarget
That’s when I discovered the RequestCountPerTarget metric (also reported by the ELB)! This metric indicates the number of requests received by each target. This metric is way more suited for scaling because it decreases with the addition of new EC2 instances as the requests are spread among available instances by the ELB. I tested by adding a target tracking scaling policy using the RequestCountPerTarget metric with a target value of 1000 requests. However, when analyzing the test results, the target tracking scaling policy was still too aggressive (from 2 to 16 instances in 15 minutes). Moreover, the target tracking scaling policy was buggy because there was no scale in even after 1 hour. This would generate a lot of additional costs, so it was unacceptable.
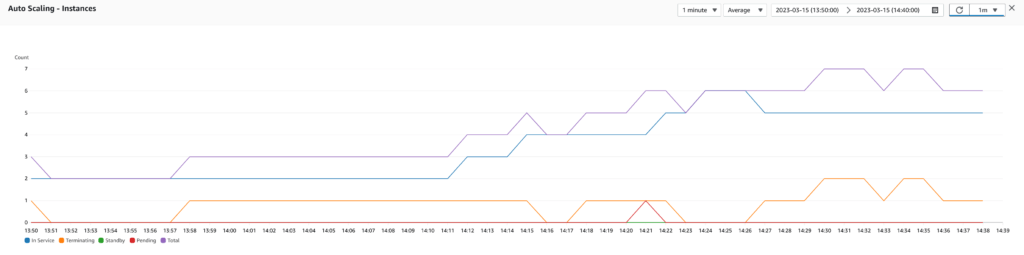
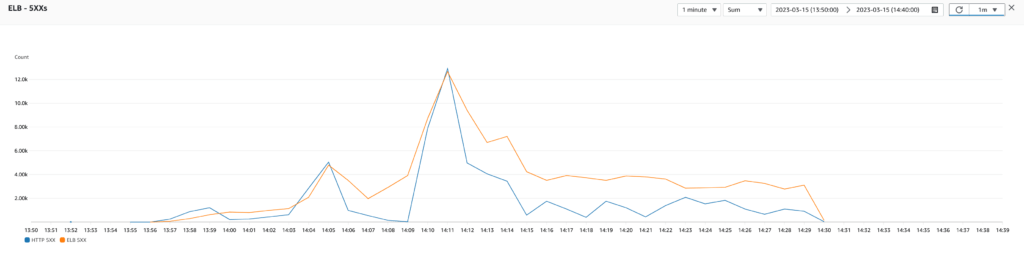
Test 4: Step scaling policy using RequestCountPerTarget
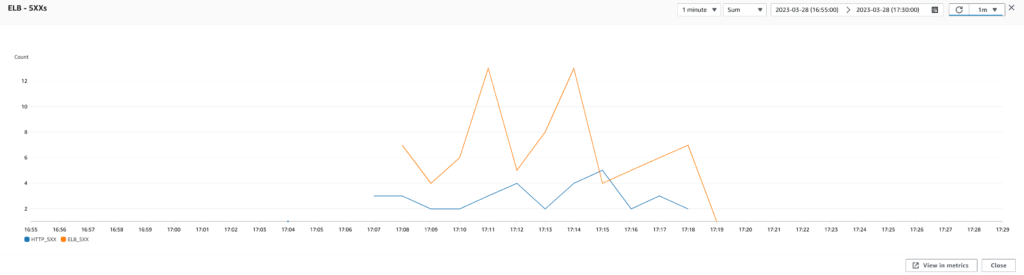
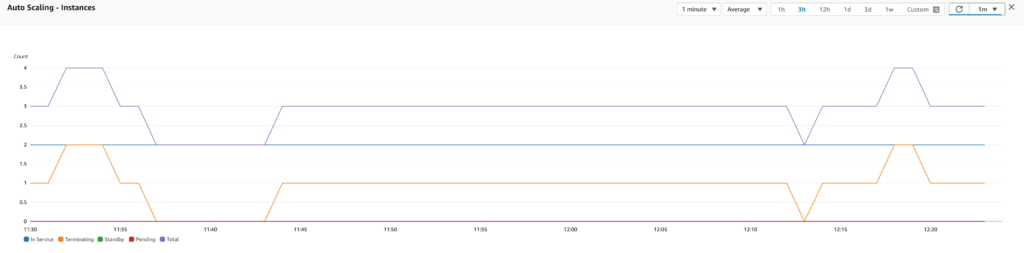
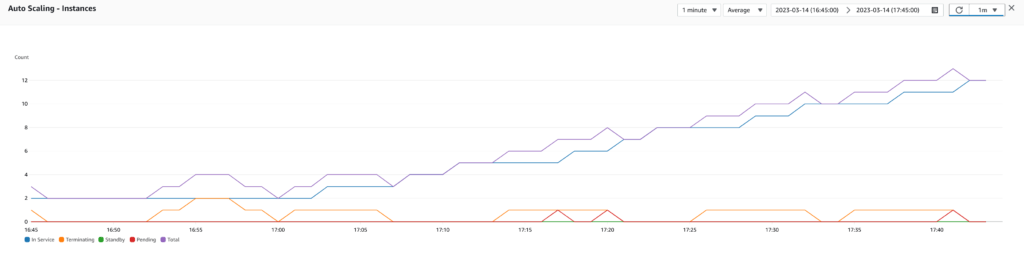
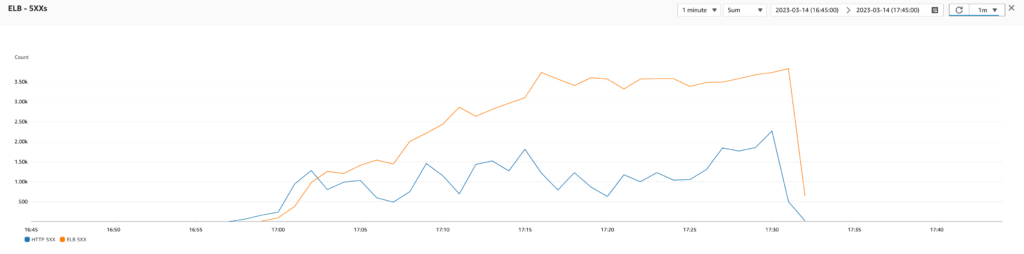
Then, I tested by adding a step scaling policy (which relies on alarms to trigger the scaling) using the RequestCountPerTarget metric. I configured the policy to scale out when there are more than 1000 requests per target during 5 minutes and to scale in when there are less than 500 requests per target during 5 minutes. Bingo! By analyzing the results, I saw that the application produced less 500 errors, and the response was slightly improved (fewer spikes but still at an average of 10 seconds). In addition, this scaling policy bumped the number of instances from 2 to 5 in 15 minutes and 5 to 2 in 20 minutes, which is reasonable for us. However, the Auto Scaling Group still needed to catch up to the actual load.
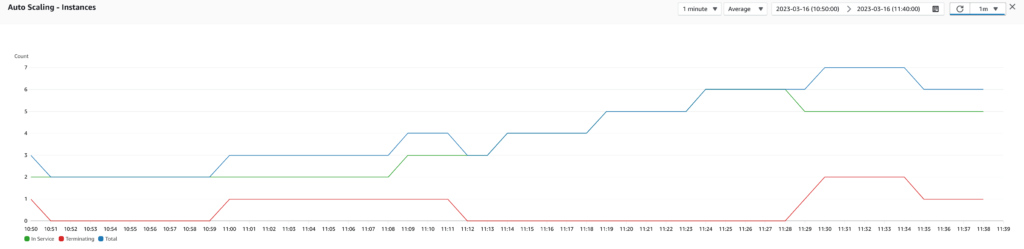
Test 5: Step scaling policy using RequestCountPerTarget and better triggers
To improve the scaling ability of the infrastructure, I tested with the same scaling policy but by reducing the required time to scale out (from 5 minutes to 3 minutes), but I kept the required time to scale in to 5 minutes to scale in smoothly. The test results were promising because the auto scaling was faster. However, there were still some spikes of 500 errors because the auto scaling was lagging behind the actual load of the application (maybe because the load generated by JMeter is a bit above what the production environment receives).
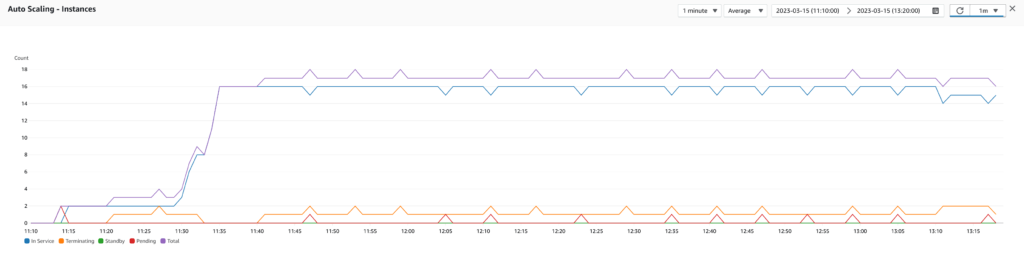
For this reason, I tested again with 3 minutes to scale out, I configured the scaling policy to trigger a scale out a bit earlier at 800 requests per target and to scale in a bit later at 400 requests per target. The test results were pretty good, and the infrastructure responded accurately to the application load. That’s it! We found our precious scaling policy.
Our new scaling policy helped prevent instances from being marked as unhealthy too often, allowing our infrastructure to scale more quickly and efficiently. This highlights the importance of defining a good scaling policy that takes into account the specific needs of the application and the infrastructure. Going forward, we will consider further improvements to the scaling policies by taking more metrics into account and potentially even generating custom metrics that combine multiple factors for a more comprehensive view of our infrastructure’s health.
Micrometer: The Magic Wand for Metrics in the Cloud
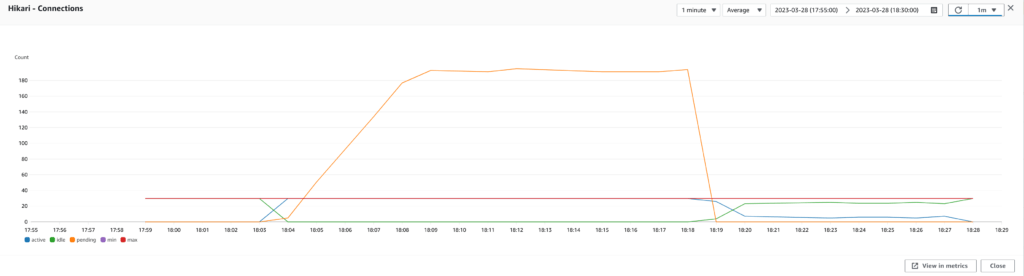
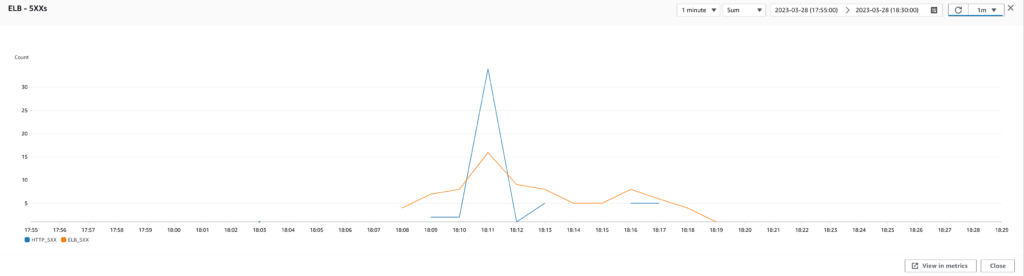
With all these changes, we were able to drastically improve the performance and availability of our application. However, we were still seeing some 500 errors in our logs, indicating that there was still room for improvement. By analyzing these errors using CloudWatch Log Insights, we discovered that our database was probably the bottleneck. However, again we were missing a lot of crucial information when reading the CloudWatch metrics, like the number of threads in waiting or timed-waiting state, the number of active Hikari connections, the number of pending Hikari connections, etc. So it was time to yet again improve the observability of our infrastructure!
I could have configured the existing CloudWatch agent and installed a CollectD daemon to report JVM metrics. Yet, it seemed complex to do with a messy configuration and some plugins to enable, and I wasn’t sure that I would be able to get all the metrics I wanted from the Spring Boot application. So to gather the metrics we needed, we turned to Micrometer, a popular metrics collection library for Java applications. We discovered that Micrometer had an agent for CloudWatch, which was perfect for our needs.
However, we needed a way to authenticate to the AWS API to publish the metrics. I wanted a simple setup to pass AWS credentials to the instances and applications (keeping in mind that we want good security and maintainability). Fortunately, we also discovered that we could use Spring Cloud AWS to automatically detect the AWS credentials when the application is deployed in an AWS cloud environment. With the correct versions of Micrometer CloudWatch Agent and Spring Cloud AWS Autoconfigure installed, all the default Spring Boot metrics were reported to CloudWatch!
Issue 1: Missing instance tag
This does not mean that there were no hitches. First, the Micrometer agent didn’t consider the fact that multiple instances were running the application. For this reason, it wasn’t possible to display the metrics of a single instance. To fix that issue, it was pretty simple. I only had to create a configuration bean to customize the CloudWatchMeterRegistry by adding a common tag to all metrics: the instance identifier. However, yet again, how do I get the instance identifier without a complex configuration? Well, it turns out that Spring Cloud AWS is also able to query the instance metadata when the application is deployed to an AWS cloud environment thanks to the Instance Metadata Service (IMDS) available from EC2 instances. With a simple @Value annotation, we can retrieve the instance identifier and pass it to the MeterRegistryCustomizer we defined to tag all metrics with the instance identifier.
@Configuration
public class CloudWatchConfiguration {

    @Value("${instance-id:N/A}")
    private String instanceId;

    @Bean
    public MeterRegistryCustomizer<CloudWatchMeterRegistry> cloudWatchMeterRegistryCustomizer() {
        return registry -> registry
                .config()
                .commonTags(Tags.of(Tag.of("instanceId", instanceId)));
    }

}
Issue 2: Too many metrics
Second, we discovered that Micrometer was sending a plethora of extraneous or irrelevant metrics that were of no use to our cause. Besides, the Micrometer CloudWatch agent follows a push model where the application needs to regularly send the metrics to CloudWatch, with only a maximum of 20 metrics permitted in a single request. As a result, the application was frequently making multiple requests each minute (the interval is configurable), which was impacting performance and consuming our valuable network bandwidth.
To top it off, each custom metric in CloudWatch incurs additional costs. When examining the intricate pricing model of CloudWatch, it appears that each custom metric beyond the first 10 offered in the free tier incurs a charge of $0.30 per month per instance for up to 10,000 metrics. To put this into perspective, by default, Micrometer generates around 300 metrics per instance, which would amount to a cost of $90 per month per instance.
To combat these issues, we needed to sift through the metrics and retain only the critical ones. Our final decision was to monitor JVM memory usage (heap and non-heap), the number of threads, the thread states, the number of Hikari connections (active, idle, pending, timeout), Hikari connection usage time, and the Hikari connection acquire time.
@Configuration
public class CloudWatchConfiguration {

    @Value("${instance-id:N/A}")
    private String instanceId;

    private final Set<String> allowedMetrics;

    public CloudWatchConfiguration() {
        allowedMetrics = new HashSet<>();

        // Memory.
        allowedMetrics.add("jvm.memory.used");
        allowedMetrics.add("jvm.memory.committed");

        // Threads.
        allowedMetrics.add("jvm.threads.live");
        allowedMetrics.add("jvm.threads.states");

        // Hikari.
        allowedMetrics.add("hikaricp.connections.active");
        allowedMetrics.add("hikaricp.connections.idle");
        allowedMetrics.add("hikaricp.connections.pending");
        allowedMetrics.add("hikaricp.connections.timeout");
        allowedMetrics.add("hikaricp.connections.usage");
        allowedMetrics.add("hikaricp.connections.acquire");
    }

    private boolean isAllowedMetric(String name) {
        return allowedMetrics.stream().anyMatch(name::startsWith);
    }

    private MeterFilter filterMetrics() {
        return MeterFilter.denyUnless(id -> isAllowedMetric(id.getName()));
    }

    @Bean
    public MeterRegistryCustomizer<CloudWatchMeterRegistry> cloudWatchMeterRegistryCustomizer() {
        return registry -> registry
                .config()
                .meterFilter(filterMetrics())
                .commonTags(Tags.of(Tag.of("instanceId", instanceId)));
    }


}
Issue 3: Too many tags
Third, we discovered that Micrometer was like an overenthusiastic tagger, adding a plethora of tags to each metric by default. While this is useful for accessing specific values within a metric, the Micrometer CloudWatch agent was sending each tag of each metric as a custom metric, leading to additional costs. To avoid this, we had to filter the tags and only keep the useful ones. In our case, we decided to only keep the “area” tag to the JVM memory usage and the “state” tag of the thread states.
@Configuration
public class CloudWatchConfiguration {

    @Value("${instance-id:N/A}")
    private String instanceId;

    private final Map<String, Set<String>> allowedMetrics;

    public CloudWatchConfiguration() {
        allowedMetrics = new HashMap<>();

        // Memory.
        allowedMetrics.put("jvm.memory.used", Set.of("area"));
        allowedMetrics.put("jvm.memory.committed", Set.of("area"));

        // Threads.
        allowedMetrics.put("jvm.threads.live", Collections.emptySet());
        allowedMetrics.put("jvm.threads.states", Set.of("state"));

        // Hikari.
        allowedMetrics.put("hikaricp.connections.active", Collections.emptySet());
        allowedMetrics.put("hikaricp.connections.idle", Collections.emptySet());
        allowedMetrics.put("hikaricp.connections.pending", Collections.emptySet());
        allowedMetrics.put("hikaricp.connections.timeout", Collections.emptySet());
        allowedMetrics.put("hikaricp.connections.usage", Collections.emptySet());
        allowedMetrics.put("hikaricp.connections.acquire", Collections.emptySet());
    }

    private boolean isAllowedMetric(String name) {
        return allowedMetrics.keySet()
                .stream()
                .anyMatch(name::startsWith);
    }

    private Optional<Set<String>> getAllowedTags(String name) {
        return allowedMetrics.entrySet()
                .stream()
                .filter(entry -> name.startsWith(entry.getKey()))
                .map(Map.Entry::getValue)
                .findFirst();
    }

    private MeterFilter filterMetrics() {
        return MeterFilter.denyUnless(id -> isAllowedMetric(id.getName()));
    }

    private MeterFilter filterMetricTags() {
        return new MeterFilter() {
            @Override
            @Nonnull
            public Meter.Id map(@Nonnull Meter.Id id) {
                Optional<Set<String>> maybeAllowedTags = getAllowedTags(id.getName());
                if (maybeAllowedTags.isPresent()) {
                    Set<String> allowedTags = maybeAllowedTags.get();
                    List<Tag> filteredTags = id.getTags()
                            .stream()
                            .filter(tag -> allowedTags.contains(tag.getKey()))
                            .toList();
                    return id.replaceTags(filteredTags);
                }
                return id;
            }
        };
    }

    @Bean
    public MeterRegistryCustomizer<CloudWatchMeterRegistry> cloudWatchMeterRegistryCustomizer() {
        return registry -> registry
                .config()
                .meterFilter(filterMetrics())
                .meterFilter(filterMetricTags())
                .commonTags(Tags.of(Tag.of("instanceId", instanceId)));
    }

}
Well, it looks like we’ve gone down a rabbit hole of AWS observability, but hey, that’s what happens when you try to tame the beast of the cloud! Configuring Micrometer and customizing the metrics it sends to CloudWatch was a crucial step in improving our observability and understanding the behavior of our infrastructure. However, our journey to improve observability doesn’t have to end here. In the future, we may want to consider using Prometheus and Grafana. With these powerhouses at our disposal, we could create dashboards so comprehensive that even our grandparents would understand what’s going on. Plus, we could indulge in more metrics without having to take out a second mortgage on our homes to pay for AWS costs.
The Great Thread Battle: Optimize the Application Configuration
Now that I had all the required metrics, I was able to dive deep into the remaining 500 errors and address them. As I mentioned earlier, these pesky errors kept popping up and pointing towards the Hikari connection pool being exhausted. So, we decided to rerun the performance tests and see what was going on. And boy, did I find something!
Extract the performance baseline
As I dug through the configuration, I realized that we had a maximum of 30 Hikari connections and a whopping 200 threads in the Tomcat server. This could have been the root cause of our problem. You see, the application was trying to handle multiple requests with 200 threads, but it was struggling to get a database connection with only 30 database connections available, resulting in timeouts.
I went on to read some technical blog posts and documentation and found that many people recommended formulas to compute the number of recommended threads for an application. It was also suggested that the number of threads should not exceed the number of database connections if most threads require access to the database. Well, we clearly missed the memo on that one!
So, I started by running a performance test with our current configuration as a baseline. And guess what? We found out that we probably had the worst configuration possible! With 200 threads and only 30 database connections, we had around 200 pending connections, leading to an excessive number of timeouts.
Run performance tests
As I dug deeper, I realized that our RDS database had a maximum of 400 connections, but we only had 30 database connections per application. This meant that each EC2 instance (which hosts two applications) had access to only 60 database connections, and with a maximum of 5 EC2 instances to handle the worst production load (as seen in our previous test results after we fixed the auto scaling), we would only use a maximum of 300 database connections out of 400. We could, therefore, afford to increase the maximum number of database connections used by the Confluence plugin application to 50 and keep the maximum number of database connections used by the Jira plugin application to 30 since it is less used than the other application.
Then, it was time for me to run multiple performance tests to determine the best values for the number of threads and the maximum number of database connections. I summarized our test results in the following table:
| Configuration | JMeter | ELB | EC2 | Application (Confluence plugin) | |||||||||||
| HTTP threads | Database connections | Samples | Response time (ms) | Error (%) | Throughput (req/s) | Response time (s) | 500 errors | 400 errors | CPU usage (%) | RAM usage (%) | Threads | Timed waiting threads | Pending DB connections | DB connection usage time (ms) | DB connection acquire time (ms) |
| 200 | 30 | 16020 | 9497 | 0.91 | 17 | 12 | 35 | 2 | 20 | 62 | 275 | 200 | 180 | 1400 | 8200 |
| 600 | 30 | 15693 | 9692 | 1.2 | 16.8 | 12 | 45 | 0 | 20 | 60 | 280 | 220 | 200 | 1400 | 9000 |
| 30 | 30 | 15395 | 9843 | 0 | 16.6 | 12 | 0 | 0 | 16 | 60 | 110 | 25 | 16 | 1200 | 700 |
| 10 | 30 | 12350 | 12280 | 0.01 | 17.3 | 14 | 0 | 4 | 16 | 50 | 80 | 8 | 0 | 1100 | 0.25 |
| 5 | 30 | 9618 | 15753 | 0.01 | 10.5 | 20 | 0 | 0 | 15 | 55 | 80 | 6 | 0 | 1100 | 0.2 |
| 200 | 50 | 16398 | 9276 | 1.06 | 17.4 | 10 | 14 | 0 | 20 | 60 | 275 | 200 | 180 | 2000 | 7500 |
| 100 | 50 | 14312 | 10662 | 0.76 | 15.2 | 14 | 12 | 0 | 18 | 65 | 180 | 85 | 80 | 2500 | 3500 |
| 70 | 50 | 16162 | 9401 | 0.11 | 17.4 | 12 | 5 | 1 | 18 | 70 | 140 | 60 | 50 | 2000 | 2000 |
| 60 | 50 | 16012 | 9506 | 0.04 | 17.1 | 12 | 2 | 2 | 18 | 60 | 140 | 40 | 35 | 2000 | 1500 |
| 50 | 50 | 15922 | 9494 | 0.01 | 17.2 | 12 | 1 | 3 | 18 | 60 | 125 | 35 | 28 | 2000 | 1100 |
| 40 | 50 | 15780 | 9617 | 0 | 17 | 12 | 0 | 2 | 20 | 60 | 120 | 25 | 18 | 2100 | 700 |
| 30 | 50 | 15662 | 9685 | 0 | 16.9 | 12 | 0 | 2 | 20 | 58 | 110 | 15 | 7 | 2000 | 200 |
The 200-Thread Battle
After analyzing, it turned out that our applications were suffering from a severe case of “thread overload”. With only 30 database connections available, our 200 threads were like kids fighting over the last slice of pizza at a birthday party. No wonder we were experiencing so many timeouts and errors! We learned that balancing the number of threads and database connections is essential to avoid timeouts and exhausted connection pools. Thorough performance tests and analysis helped us optimize our application and find the optimal configuration for our use case. By implementing these lessons, we made the applications more stable and performant.
In the end, the test results and playing around with different values, we finally found the optimal configuration for our use case. The Confluence plugin app needed 30 threads and 50 database connections, while the Jira plugin app needed 30 threads and 30 database connections. And with this, we optimized the configuration for the number of threads and database connections to resolve a lot of timeouts and 500 errors.
Conclusion
Phew! That was quite a journey, but we made it out alive! From Auto Scaling Groups to Hikari connection pools, we tackled every problem that came our way. Throughout this journey, we learned valuable lessons that can help us and other teams facing similar challenges.
First and foremost, monitoring and observability are essential for understanding the behavior of our infrastructure and identifying bottlenecks and issues. Using CloudWatch and Micrometer, we were able to gather crucial metrics and customize them to focus on the critical areas of our applications.
Secondly, scaling policies are key to ensuring that our infrastructure can handle the varying loads of our applications. Through thorough performance tests and analysis, we found that a step scaling policy using the number of requests per target was the best fit for our use case.
Thirdly, balancing the number of threads and database connections is essential to avoiding timeouts and exhausted connection pools. Through thorough performance tests and analysis, we found that 30 threads for 50 database connections was the best configuration for our application.
Finally, there’s always room for improvement. We have a lot of ideas to further enhance our AWS infrastructure! Who knows what our next blog post will be about? Maybe we’ll start using Packer to automatically build our golden AMIs, maybe we’ll make the switch to ECS and Fargate to avoid managing EC2 instances altogether, or perhaps we’ll build a robot barista that makes the perfect cup of coffee (we can dream, can’t we?).
Requirement Yogi is a tool to manage requirements in Atlassian Confluence. Checkout our case study on requirement management in the health industry, where we share valuable insights and lessons learned from real-world experiences!